Ingest and Query ECMWF IFS Forecast
This demo notebook shows how to ingest data from the ECMWF IFS forecast model into Arraylake. We then query the data via Python and via Flux APIs.
Define Download Functions
These functions download GRIB files and open them as a single Xarray dataset for each forecast.
import arraylake
import pandas as pd
import xarray as xr
import s3fs
import tempfile
from datetime import datetime, timedelta
from tqdm import tqdm
from dask.diagnostics import ProgressBar
from concurrent.futures import ThreadPoolExecutor, as_completed


def make_url(forecast_time: datetime, step_hour: int) -> str:
    date_str = forecast_time.strftime("%Y%m%d")
    z_str = forecast_time.strftime("%H")
    time_str = forecast_time.strftime("%H%M%S")
    step_str = f"{step_hour}h"
    return f"s3://ecmwf-forecasts/{date_str}/{z_str}z/ifs/0p25/oper/{date_str}{time_str}-{step_str}-oper-fc.grib2"


def get_step(forecast_time: datetime, step_hour: int) -> xr.Dataset:
    s3 = s3fs.S3FileSystem()
    url = make_url(forecast_time, step_hour)
    # print(f"downloading {url}")
    with tempfile.NamedTemporaryFile() as tf:
        try:
            s3.download(url, tf.name)
        except FileNotFoundError as e:
            raise FileNotFoundError(url) from e
        ds = xr.open_dataset(
            tf.name,
            engine="cfgrib",
            decode_timedelta=True,
            backend_kwargs={"filter_by_keys": {"typeOfLevel": "surface"}},
        )
        ds = ds.expand_dims(("time", "step"))  # triggers loading
    ds = ds.drop_vars("valid_time")
    ds = ds[set(ds) - {"sdor", "slor", "z"}]  # drop variables not present in each file
    ds = ds.chunk()
    ds.time.attrs["axis"] = "T"
    ds.latitude.attrs["axis"] = "Y"
    ds.longitude.attrs["axis"] = "X"
    return ds


def get_dataset(forecast_date: datetime, hours: list[int]) -> xr.Dataset:
    with ThreadPoolExecutor() as executor:
        all_futures = [executor.submit(get_step, forecast_date, hour) for hour in hours]
        datasets = [fut.result() for fut in tqdm(as_completed(all_futures), total=len(all_futures))]
    datasets.sort(key=lambda ds: ds.step.values)
    ds = xr.concat(datasets, dim="step")
    ds = ds.chunk({"step": 5, "latitude": 240, "longitude": 360})
    return ds
Create a New Arraylake Repo
client = arraylake.Client()
client
Output
Client(service_uri='https://api.earthmover.io')
repo = client.create_repo("earthmover-demos/ecmwf-ifs-oper")
repo
Output
<icechunk.repository.Repository at 0x7fdb24913140>
Download Data
forecast_date = datetime(2025, 1, 1, 0, 0, 0)

# these are the hours when forecasts are available
hours = list(range(0, 144 + 1, 3))  # + list(range(150, 360+1, 6))
ds = get_dataset(forecast_date, hours)
print(ds)
Output
100%|██████████| 49/49 [00:29<00:00, 1.65it/s]
Output
<xarray.Dataset> Size: 3GB
Dimensions:    (time: 1, step: 49, latitude: 721, longitude: 1440)
Coordinates:
  * time       (time) datetime64[ns] 8B 2025-01-01
  * step       (step) timedelta64[ns] 392B 0 days 00:00:00 ... 6 days 00:00:00
    surface    float64 8B 0.0
  * latitude   (latitude) float64 6kB 90.0 89.75 89.5 ... -89.5 -89.75 -90.0
  * longitude  (longitude) float64 12kB -180.0 -179.8 -179.5 ... 179.5 179.8
Data variables: (12/15)
    strd       (time, step, latitude, longitude) float32 203MB dask.array<chunksize=(1, 5, 240, 360), meta=np.ndarray>
    skt        (time, step, latitude, longitude) float32 203MB dask.array<chunksize=(1, 5, 240, 360), meta=np.ndarray>
    nsss       (time, step, latitude, longitude) float32 203MB dask.array<chunksize=(1, 5, 240, 360), meta=np.ndarray>
    str        (time, step, latitude, longitude) float32 203MB dask.array<chunksize=(1, 5, 240, 360), meta=np.ndarray>
    ssrd       (time, step, latitude, longitude) float32 203MB dask.array<chunksize=(1, 5, 240, 360), meta=np.ndarray>
    ptype      (time, step, latitude, longitude) float32 203MB dask.array<chunksize=(1, 5, 240, 360), meta=np.ndarray>
    ...         ...
    lsm        (time, step, latitude, longitude) float32 203MB dask.array<chunksize=(1, 5, 240, 360), meta=np.ndarray>
    asn        (time, step, latitude, longitude) float32 203MB dask.array<chunksize=(1, 5, 240, 360), meta=np.ndarray>
    ssr        (time, step, latitude, longitude) float32 203MB dask.array<chunksize=(1, 5, 240, 360), meta=np.ndarray>
    sp         (time, step, latitude, longitude) float32 203MB dask.array<chunksize=(1, 5, 240, 360), meta=np.ndarray>
    ewss       (time, step, latitude, longitude) float32 203MB dask.array<chunksize=(1, 5, 240, 360), meta=np.ndarray>
    ro         (time, step, latitude, longitude) float32 203MB dask.array<chunksize=(1, 5, 240, 360), meta=np.ndarray>
Attributes:
    GRIB_edition:            2
    GRIB_centre:             ecmf
    GRIB_centreDescription:  European Centre for Medium-Range Weather Forecasts
    GRIB_subCentre:          0
    Conventions:             CF-1.7
    institution:             European Centre for Medium-Range Weather Forecasts
    history:                 2025-07-15T18:43 GRIB to CDM+CF via cfgrib-0.9.1...
Ingest to Arraylake
with repo.transaction("main", message="wrote initial dataset") as store:
    with ProgressBar():
        ds.to_zarr(store, zarr_format=3, consolidated=False)
Output
[########################################] | 100% Completed | 13.59 s
The repo is now visible in the Arraylake web app at https://app.earthmover.io/earthmover-demos/ecmwf-ifs-oper
Download and Append Another Forecast
ds = get_dataset(datetime(2025, 1, 2, 0, 0, 0), hours)
with repo.transaction("main", message="appended a forecast") as store:
    with ProgressBar():
        ds.to_zarr(store, zarr_format=3, consolidated=False, mode="a", append_dim="time")
Output
100%|██████████| 49/49 [00:24<00:00, 1.97it/s]
Output
[########################################] | 100% Completed | 13.64 ss
Query with Python
We can now easily query back our data at lightning speed.
ds_al = xr.open_zarr(repo.readonly_session("main").store, decode_timedelta=True, consolidated=False)
print(ds_al)
Output
<xarray.Dataset> Size: 6GB
Dimensions:    (time: 2, step: 49, latitude: 721, longitude: 1440)
Coordinates:
  * latitude   (latitude) float64 6kB 90.0 89.75 89.5 ... -89.5 -89.75 -90.0
  * longitude  (longitude) float64 12kB -180.0 -179.8 -179.5 ... 179.5 179.8
  * step       (step) timedelta64[ns] 392B 0 days 00:00:00 ... 6 days 00:00:00
    surface    float64 8B ...
  * time       (time) datetime64[ns] 16B 2025-01-01 2025-01-02
Data variables: (12/15)
    skt        (time, step, latitude, longitude) float32 407MB dask.array<chunksize=(1, 5, 240, 360), meta=np.ndarray>
    ptype      (time, step, latitude, longitude) float32 407MB dask.array<chunksize=(1, 5, 240, 360), meta=np.ndarray>
    nsss       (time, step, latitude, longitude) float32 407MB dask.array<chunksize=(1, 5, 240, 360), meta=np.ndarray>
    sp         (time, step, latitude, longitude) float32 407MB dask.array<chunksize=(1, 5, 240, 360), meta=np.ndarray>
    ewss       (time, step, latitude, longitude) float32 407MB dask.array<chunksize=(1, 5, 240, 360), meta=np.ndarray>
    ro         (time, step, latitude, longitude) float32 407MB dask.array<chunksize=(1, 5, 240, 360), meta=np.ndarray>
    ...         ...
    lsm        (time, step, latitude, longitude) float32 407MB dask.array<chunksize=(1, 5, 240, 360), meta=np.ndarray>
    ssrd       (time, step, latitude, longitude) float32 407MB dask.array<chunksize=(1, 5, 240, 360), meta=np.ndarray>
    tp         (time, step, latitude, longitude) float32 407MB dask.array<chunksize=(1, 5, 240, 360), meta=np.ndarray>
    tprate     (time, step, latitude, longitude) float32 407MB dask.array<chunksize=(1, 5, 240, 360), meta=np.ndarray>
    strd       (time, step, latitude, longitude) float32 407MB dask.array<chunksize=(1, 5, 240, 360), meta=np.ndarray>
    unknown    (time, step, latitude, longitude) float32 407MB dask.array<chunksize=(1, 5, 240, 360), meta=np.ndarray>
Attributes:
    GRIB_edition:            2
    GRIB_centre:             ecmf
    GRIB_centreDescription:  European Centre for Medium-Range Weather Forecasts
    GRIB_subCentre:          0
    Conventions:             CF-1.7
    institution:             European Centre for Medium-Range Weather Forecasts
    history:                 2025-07-15T18:43 GRIB to CDM+CF via cfgrib-0.9.1...
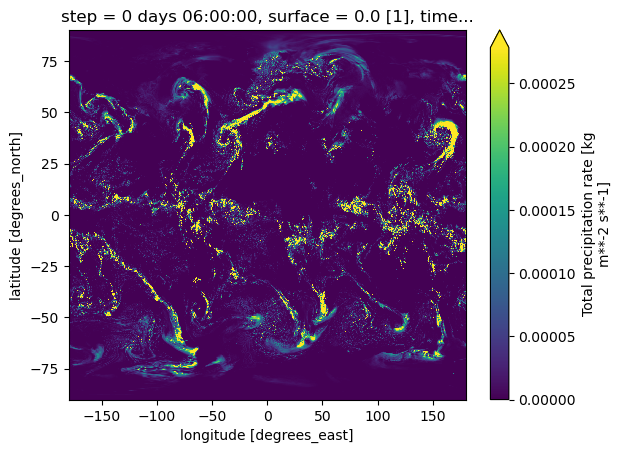
ds_al.sel(time="2025-01-01", step=timedelta(hours=6)).tprate.plot(robust=True)
Output
<matplotlib.collections.QuadMesh at 0x7fd988799f40>
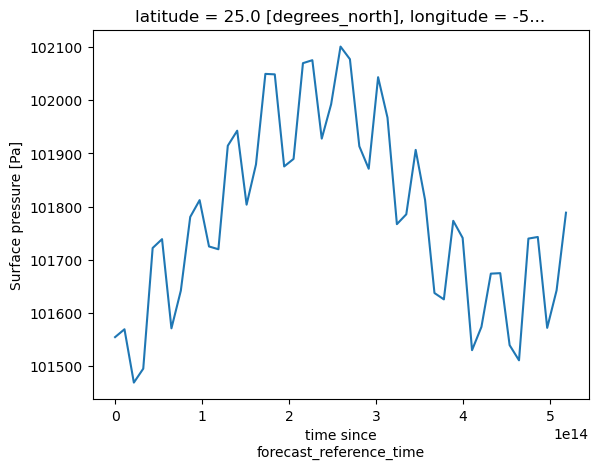
ds_al.sp.sel(time="2025-01-01", longitude=-50, latitude=25, method="nearest").plot()
Output
[<matplotlib.lines.Line2D at 0x7fd9803f0200>]
Query with Flux
We can also easily view our data with Flux APIs.
from ipyleaflet import Map, WMSLayer

url = (
    "https://compute.earthmover.io/v1/services/wms/earthmover-demos/ecmwf-ifs-oper/main/wms?"
    "version=1.3.0&service=WMS&request=GetMap&crs=EPSG:3857&time=2025-01-01T00:00:00Z&step=12+hr&colorscalerange=0,0.001"
)
m = Map(center=(52, 360), zoom=2)
wms = WMSLayer(
    url=url,
    layers="tprate",
    styles="raster/Blues",
    opacity=0.8,
)
m.add(wms)
m
Output
Map(center=[52, 360], controls=(ZoomControl(options=['position', 'zoom_in_text', 'zoom_in_title', 'zoom_out_te…
url = (
"https://compute.earthmover.io/v1/services/edr/earthmover-demos/ecmwf-ifs-oper/main/edr/position?"
"coords=POINT(-50%2025)&time=2025-01-01T00:00:00¶meter-name=sp&f=csv"
)
df = pd.read_csv(url)
print(df)
Output
          time             step  latitude  longitude          sp  surface  \
0   2025-01-01  0 days 00:00:00      25.0      -50.0  101553.810      0.0
1   2025-01-01  0 days 03:00:00      25.0      -50.0  101568.630      0.0
2   2025-01-01  0 days 06:00:00      25.0      -50.0  101468.125      0.0
3   2025-01-01  0 days 09:00:00      25.0      -50.0  101494.340      0.0
4   2025-01-01  0 days 12:00:00      25.0      -50.0  101721.830      0.0
5   2025-01-01  0 days 15:00:00      25.0      -50.0  101738.530      0.0
6   2025-01-01  0 days 18:00:00      25.0      -50.0  101570.375      0.0
7   2025-01-01  0 days 21:00:00      25.0      -50.0  101641.440      0.0
8   2025-01-01  1 days 00:00:00      25.0      -50.0  101780.380      0.0
9   2025-01-01  1 days 03:00:00      25.0      -50.0  101812.060      0.0
10  2025-01-01  1 days 06:00:00      25.0      -50.0  101724.740      0.0
11  2025-01-01  1 days 09:00:00      25.0      -50.0  101719.470      0.0
12  2025-01-01  1 days 12:00:00      25.0      -50.0  101914.630      0.0
13  2025-01-01  1 days 15:00:00      25.0      -50.0  101942.960      0.0
14  2025-01-01  1 days 18:00:00      25.0      -50.0  101803.500      0.0
15  2025-01-01  1 days 21:00:00      25.0      -50.0  101879.440      0.0
16  2025-01-01  2 days 00:00:00      25.0      -50.0  102050.060      0.0
17  2025-01-01  2 days 03:00:00      25.0      -50.0  102049.170      0.0
18  2025-01-01  2 days 06:00:00      25.0      -50.0  101875.580      0.0
19  2025-01-01  2 days 09:00:00      25.0      -50.0  101889.750      0.0
20  2025-01-01  2 days 12:00:00      25.0      -50.0  102070.300      0.0
21  2025-01-01  2 days 15:00:00      25.0      -50.0  102075.890      0.0
22  2025-01-01  2 days 18:00:00      25.0      -50.0  101928.050      0.0
23  2025-01-01  2 days 21:00:00      25.0      -50.0  101992.780      0.0
24  2025-01-01  3 days 00:00:00      25.0      -50.0  102101.550      0.0
25  2025-01-01  3 days 03:00:00      25.0      -50.0  102077.770      0.0
26  2025-01-01  3 days 06:00:00      25.0      -50.0  101913.640      0.0
27  2025-01-01  3 days 09:00:00      25.0      -50.0  101871.240      0.0
28  2025-01-01  3 days 12:00:00      25.0      -50.0  102043.800      0.0
29  2025-01-01  3 days 15:00:00      25.0      -50.0  101967.590      0.0
30  2025-01-01  3 days 18:00:00      25.0      -50.0  101766.770      0.0
31  2025-01-01  3 days 21:00:00      25.0      -50.0  101785.370      0.0
32  2025-01-01  4 days 00:00:00      25.0      -50.0  101906.766      0.0
33  2025-01-01  4 days 03:00:00      25.0      -50.0  101812.310      0.0
34  2025-01-01  4 days 06:00:00      25.0      -50.0  101636.960      0.0
35  2025-01-01  4 days 09:00:00      25.0      -50.0  101625.000      0.0
36  2025-01-01  4 days 12:00:00      25.0      -50.0  101773.070      0.0
37  2025-01-01  4 days 15:00:00      25.0      -50.0  101740.850      0.0
38  2025-01-01  4 days 18:00:00      25.0      -50.0  101529.200      0.0
39  2025-01-01  4 days 21:00:00      25.0      -50.0  101573.140      0.0
40  2025-01-01  5 days 00:00:00      25.0      -50.0  101673.484      0.0
41  2025-01-01  5 days 03:00:00      25.0      -50.0  101674.410      0.0
42  2025-01-01  5 days 06:00:00      25.0      -50.0  101538.670      0.0
43  2025-01-01  5 days 09:00:00      25.0      -50.0  101510.090      0.0
44  2025-01-01  5 days 12:00:00      25.0      -50.0  101739.600      0.0
45  2025-01-01  5 days 15:00:00      25.0      -50.0  101742.610      0.0
46  2025-01-01  5 days 18:00:00      25.0      -50.0  101571.250      0.0
47  2025-01-01  5 days 21:00:00      25.0      -50.0  101641.984      0.0
48  2025-01-01  6 days 00:00:00      25.0      -50.0  101788.420      0.0

    spatial_ref
0             0
1             0
2             0
3             0
4             0
5             0
6             0
7             0
8             0
9             0
10            0
11            0
12            0
13            0
14            0
15            0
16            0
17            0
18            0
19            0
20            0
21            0
22            0
23            0
24            0
25            0
26            0
27            0
28            0
29            0
30            0
31            0
32            0
33            0
34            0
35            0
36            0
37            0
38            0
39            0
40            0
41            0
42            0
43            0
44            0
45            0
46            0
47            0
48            0
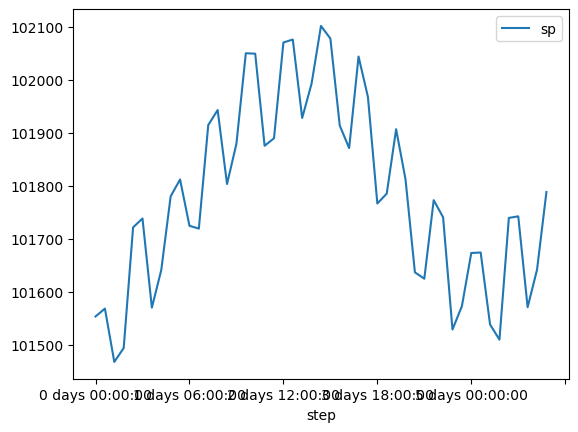
df.plot(x="step", y="sp")
Output
<Axes: xlabel='step'>
[Optional] Clean Up by Deleting Repo
! al repo delete earthmover-demos/ecmwf-ifs-oper --confirm
Output
[2K[1;32m✓[0m Deleting repo [1mearthmover-demos/ecmwf-ifs-oper[0m...[1;32msucceeded[0m
[?25hRepo [1mearthmover-demos/ecmwf-ifs-oper[0m removed from Arraylake.
The underlying Icechunk bucket must be deleted manually.