WMS: Web Map Service
WMS is currently in private beta. Features and capabilities may change with time.
WMS is a standard of the Open Geospatial Consortium (OGC)
WMS provides a simple HTTP interface for requesting geo-registered map images from one or more distributed geospatial databases.
References
These are links to OGC standards and websites:
Arraylake implements the full WMS standard v1.3.0 and a handful of ncWMS extensions.
Specifically the GetTimeseries, GetVerticalProfile, GetLegendGraphic, and GetMetadata extensions are supported.
Activating WMS for Arraylake Datasets
WMS can be activated using the Arraylake command line interface (CLI)
al compute enable {org} wms
Arraylake currently supports enabling WMS on an organization-wide basis. This is subject to change during the beta period.
WMS works best when datasets are compliant with CF Conventions,
particularly around coordinates. Specifically it requires that the cf-xarray
package be able to identify the "latitude", "longitude", "time", and "vertical" coordinate arrays.
Generally these means that variables with standard_name: latitude, standard_name: longitude,
standard_name: time (if applicable) attributes must be present.
For "elevation", the criteria are more complex. Either positive:up or positive:down must be set
or the standard_name must be set to one of the possibilities listed in the cf-xarray
documentation.
The dataset must be in the EPSG:4326 coordinate system. Other reference systems will be supported in the future.
GIS software, e.g. ArcGIS or QGIS, can have trouble with our WMS service. We are aware of this issue and will fix it in the near future.
WMS URL Structure
WMS endpoints can be accessed via the following URL schema.
https://compute.earthmover.io/v1/services/wms/{org}/{repo}/{branch|commit|tag}/{path/to/group}/wms
Where
{org}is the name of your Arraylake organization{repo}is the name of the Repo{branch|commit|tag}is the branch, commit, or tag within the Repo to use to fulfill the request{path/to/group}is the path to group within the Repo that contains anxarrayDataset
Integrating with Tools
MapboxGL
You can visualize WMS layers in MapboxGL by adding a raster source and layer
Code
<!DOCTYPE html>
<html>
<head>
<meta charset='utf-8'>
<title>Arraylake WMS Example</title>
<meta name='viewport' content='initial-scale=1,maximum-scale=1,user-scalable=no'>
<link href='https://api.mapbox.com/mapbox-gl-js/v3.9.3/mapbox-gl.css' rel='stylesheet'>
<script src='https://api.mapbox.com/mapbox-gl-js/v3.9.3/mapbox-gl.js'></script>
<style>
body { margin: 0; padding: 0; }
#map { position: absolute; top: 0; bottom: 0; width: 100%; }
</style>
</head>
<body>
<div id='map'></div>
<script>
	mapboxgl.accessToken = 'YOUR_MAPBOX_GL_KEY';
    const map = new mapboxgl.Map({
        container: 'map',
        style: 'mapbox://styles/mapbox/light-v11',
        zoom: 1,
        center: [-74.5447, 40.6892]
    });

    map.on('load', () => {
        map.addSource('wms-test-source', {
            'type': 'raster',
            'tiles': [
                'https://compute.earthmover.io/v1/services/wms/earthmover-demos/gfs/main/solar/wms?version=1.3.0&service=WMS&request=GetMap&layers=gust&styles=raster/default&width=256&height=256&tile={x},{y},{z}&crs=EPSG:3857&time=2024-11-1T00:00:00Z&colorscalerange=0,40&step=1+hour'
            ],
            'tileSize': 256
        });
        map.addLayer(
            {
                'id': 'wms-test-layer',
                'type': 'raster',
                'source': 'wms-test-source',
                'paint': {}
            },
            'building' // Place layer under labels, roads and buildings.
        );
    });
</script>

</body>
</html>
QGIS
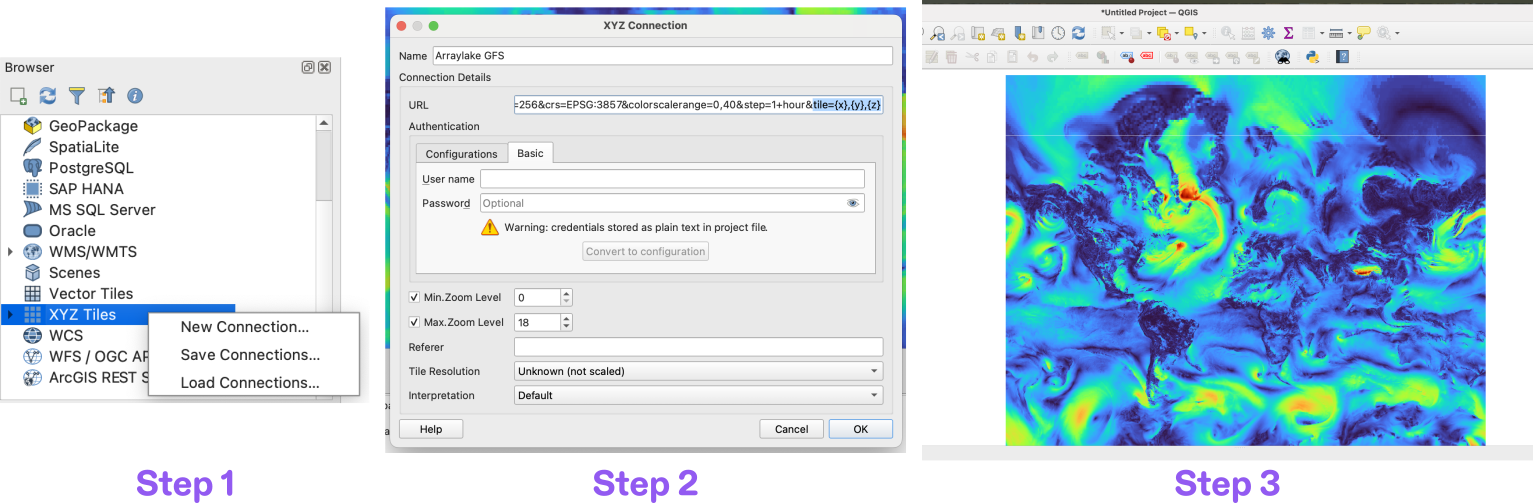
The most straightforward way to setup the WMS service in QGIS today is to use it to serve XYZ tiles.
- Add a new "XYZ Connection".
- In the URL box, pass a URL like
https://compute.earthmover.io/v1/services/wms/{org}/{repo}/{branch|commit|tag}/{path/to/group}/wms?{all_params}&tile={x},{y},{z}. Note that you must specifytile={x},{y},{z}. If needed pass in credentials under "Basic Authentication". - The layer should now be visible in your Project.
WMS layer support in QGIS will be available soon!
ipyleaflet
The following snippet works well in a Jupyter notebook with ipyleaflet and jupyter_leaflet installed.
from ipyleaflet import Map, WMSLayer, basemaps


class ArraylakeWMSLayer(WMSLayer):
    from traitlets import Bool, Unicode

    colorscalerange = Unicode('0,1').tag(sync=True, o=True)
    autoscale = Bool(False).tag(sync=True, o=True)
    version = Unicode("1.3.0")

wms = ArraylakeWMSLayer(
    url='https://compute.earthmover.io/v1/services/wms/earthmover-demos/gfs/main/solar/wms',
    layers='gust',
    styles="raster/default",
    colorscalerange='0,40',
    transparent=True,
    attribution='GFS weather forecast data | Served with Arraylake'
)

m = Map(basemap=basemaps.CartoDB.Positron, center=(38.491, -95.712), zoom=5)

m.add(wms)

m
Queries
The following URL schema will be called {base_url} in the examples below.
https://compute.earthmover.io/v1/services/wms/{org}/{repo}/{branch|commit|tag}/{path/to/group}/wms
Where
{org}is the name of your Arraylake organization{repo}is the name of the Repo{branch|commit|tag}is the branch, commit, or tag within the Repo to use to fulfill the request{path/to/group}is the path to group within the Repo that contains anxarrayDataset. If the dataset is stored in the root group, this should be omitted.
All examples use the HTTP GET protocol.
Specific examples in this guide will use the Arraylake GFS Repo.
The underlying GFS dataset has the following structure:
<xarray.Dataset> Size: 3TB
Dimensions:    (longitude: 1440, latitude: 721, time: 736, step: 209)
Coordinates:
  * latitude   (latitude) float64 6kB 90.0 89.75 89.5 ... -89.5 -89.75 -90.0
  * longitude  (longitude) float64 12kB 0.0 0.25 0.5 0.75 ... 359.2 359.5 359.8
  * step       (step) timedelta64[ns] 2kB 00:00:00 01:00:00 ... 16 days 00:00:00
  * time       (time) datetime64[ns] 6kB 2024-05-12T18:00:00 ... 2024-11-12T1...
Data variables:
    gust       (longitude, latitude, time, step) float32 639GB ...
    prate      (longitude, latitude, time, step) float32 639GB ...
    r2         (longitude, latitude, time, step) float32 639GB ...
    t2m        (longitude, latitude, time, step) float32 639GB ...
    tcc        (longitude, latitude, time, step) float32 639GB ...
Attributes:
    description:  GFS data ingested for forecasting demo
Metadata Queries
GetMetadata
The GetMetadata query is useful for understanding what queries can be made. This example query lists the specific timesteps that can be requested, and that an additional
dimension step is available for subsetting.
$ curl https://compute.earthmover.io/v1/services/wms/earthmover-demos/gfs/main/solar/wms/\?version\=1.3.0\&service\=WMS\&request\=GetMetadata\&item\=layerdetails\&layername\=gust
Details
The full time and step coordinate values have been truncated for brevity.
response
{
  "layerName": "gust",
  "standard_name": "unknown",
  "long_name": "Wind speed (gust)",
  "bbox": [-179.75, -90.0, 180.0, 90.0],
  "units": "m s**-1",
  "supportedStyles": ["raster"],
  "elevation": null,
  "elevation_positive": null,
  "elevation_units": null,
  "timesteps": [
    "2024-05-12T18:00:00Z",
    "2024-05-13T00:00:00Z",
    "[SNIP]",
    "2025-01-22T12:00:00Z",
    "2025-01-22T18:00:00Z",
    "2025-01-23T00:00:00Z",
    "2025-01-23T06:00:00Z",
    "2025-01-23T12:00:00Z",
    "2025-01-23T18:00:00Z",
    "2025-01-24T00:00:00Z",
    "2025-01-24T06:00:00Z"
  ],
  "additional_coords": ["step"],
  "step": [
    0,
    3600000000000,
    7200000000000,
    "[SNIP]",
    1371600000000000,
    1382400000000000
  ]
}
GetCapabilities
$ curl https://compute.earthmover.io/v1/services/wms/earthmover-demos/gfs/main/solar/wms/\?version=1.3.0\&service=WMS\&request=GetCapabilities
Details
The full time and step coordinate values have been truncated for brevity.
response
<WMS_Capabilities xmlns="http://www.opengis.net/wms" xmlns:xlink="http://www.w3.org/1999/xlink" version="1.3.0">
<Service>
<Name>WMS</Name>
<Title>XPublish WMS</Title>
<Abstract>XPublish WMS</Abstract>
<KeywordList />
<OnlineResource xmlns:xlink="http://www.w3.org/1999/xlink" xlink:type="simple" xlink:href="http://www.opengis.net/spec/wms_schema_1/1.3.0" />
</Service>
<Capability>
<Request>
<GetCapabilities>
<Format>text/xml</Format>
<DCPType>
<HTTP>
<Get>
<OnlineResource xmlns:xlink="http://www.w3.org/1999/xlink" xlink:type="simple" xlink:href="http://compute.earthmover.io/services/earthmover-demos/gfs/main/solar/wms/" />
</Get>
</HTTP>
</DCPType>
</GetCapabilities>
<GetMap>
<Format>image/png</Format>
<DCPType>
<HTTP>
<Get>
<OnlineResource xmlns:xlink="http://www.w3.org/1999/xlink" xlink:type="simple" xlink:href="http://compute.earthmover.io/services/earthmover-demos/gfs/main/solar/wms/" />
</Get>
</HTTP>
</DCPType>
</GetMap>
<GetFeatureInfo>
<Format>text/json</Format>
<DCPType>
<HTTP>
<Get>
<OnlineResource xmlns:xlink="http://www.w3.org/1999/xlink" xlink:type="simple" xlink:href="http://compute.earthmover.io/services/earthmover-demos/gfs/main/solar/wms/" />
</Get>
</HTTP>
</DCPType>
</GetFeatureInfo>
<GetLegendGraphic>
<Format>image/png</Format>
<DCPType>
<HTTP>
<Get>
<OnlineResource xmlns:xlink="http://www.w3.org/1999/xlink" xlink:type="simple" xlink:href="http://compute.earthmover.io/services/earthmover-demos/gfs/main/solar/wms/" />
</Get>
</HTTP>
</DCPType>
</GetLegendGraphic>
</Request>
<Exception>
<Format>text/json</Format>
</Exception>
<Layer>
<Title>Untitled</Title>
<Description>GFS data ingested for forecasting demo</Description>
<CRS>EPSG:4326</CRS>
<CRS>EPSG:3857</CRS>
<Layer queryable="1">
<Name>gust</Name>
<Title>unknown</Title>
<Abstract>gust</Abstract>
<CRS>EPSG:4326</CRS>
<CRS>EPSG:3857</CRS>
<CRS>CRS:84</CRS>
<Units>m s**-1</Units>
<BoundingBox CRS="EPSG:4326" minx="-179.75" miny="-90.0" maxx="180.0" maxy="90.0" />
<Dimension name="time" units="ISO8601" default="2025-01-24T06:00:00Z">2024-05-12T18:00:00Z,[SNIP],2025-01-24T00:00:00Z,2025-01-24T06:00:00Z</Dimension>
<Dimension name="step" units="" default="0 nanoseconds">0 nanoseconds,3600000000000 nanoseconds,[SNIP],1382400000000000 nanoseconds</Dimension>
<Style>
<Name>raster/default</Name>
<Title>Raster</Title>
<Abstract>The default raster styling, scaled to the given range. The palette can be overridden by replacing default with a matplotlib colormap name</Abstract>
<LegendURL>http://compute.earthmover.io/services/earthmover-demos/gfs/main/solar/wms/?service=WMS&request=GetLegendGraphic&format=image/png&width=20&height=20&layers=gust&styles=raster/default</LegendURL>
</Style>
</Layer>
<Layer queryable="1">
<Name>prate</Name>
<Title>unknown</Title>
<Abstract>prate</Abstract>
<CRS>EPSG:4326</CRS>
<CRS>EPSG:3857</CRS>
<CRS>CRS:84</CRS>
<Units>kg m**-2 s**-1</Units>
<BoundingBox CRS="EPSG:4326" minx="-179.75" miny="-90.0" maxx="180.0" maxy="90.0" />
<Dimension name="time" units="ISO8601" default="2025-01-24T06:00:00Z">2024-05-12T18:00:00Z,[SNIP],2025-01-24T06:00:00Z</Dimension>
<Dimension name="step" units="" default="0 nanoseconds">0 nanoseconds,3600000000000 nanoseconds,[SNIP],1350000000000000 nanoseconds,1360800000000000 nanoseconds,1371600000000000 nanoseconds,1382400000000000 nanoseconds</Dimension>
<Style>
<Name>raster/default</Name>
<Title>Raster</Title>
<Abstract>The default raster styling, scaled to the given range. The palette can be overridden by replacing default with a matplotlib colormap name</Abstract>
<LegendURL>http://compute.earthmover.io/services/earthmover-demos/gfs/main/solar/wms/?service=WMS&request=GetLegendGraphic&format=image/png&width=20&height=20&layers=prate&styles=raster/default</LegendURL>
</Style>
</Layer>
<Layer queryable="1">
<Name>r2</Name>
<Title>relative_humidity</Title>
<Abstract>r2</Abstract>
<CRS>EPSG:4326</CRS>
<CRS>EPSG:3857</CRS>
<CRS>CRS:84</CRS>
<Units>%</Units>
<BoundingBox CRS="EPSG:4326" minx="-179.75" miny="-90.0" maxx="180.0" maxy="90.0" />
<Dimension name="time" units="ISO8601" default="2025-01-24T06:00:00Z">2024-05-12T18:00:00Z,2024-05-13T00:00:00Z,[SNIP],2025-01-24T00:00:00Z,2025-01-24T06:00:00Z</Dimension>
<Dimension name="step" units="" default="0 nanoseconds">0 nanoseconds,3600000000000 nanoseconds,[SNIP],1371600000000000 nanoseconds,1382400000000000 nanoseconds</Dimension>
<Style>
<Name>raster/default</Name>
<Title>Raster</Title>
<Abstract>The default raster styling, scaled to the given range. The palette can be overridden by replacing default with a matplotlib colormap name</Abstract>
<LegendURL>http://compute.earthmover.io/services/earthmover-demos/gfs/main/solar/wms/?service=WMS&request=GetLegendGraphic&format=image/png&width=20&height=20&layers=r2&styles=raster/default</LegendURL>
</Style>
</Layer>
<Layer queryable="1">
<Name>t2m</Name>
<Title>air_temperature</Title>
<Abstract>t2m</Abstract>
<CRS>EPSG:4326</CRS>
<CRS>EPSG:3857</CRS>
<CRS>CRS:84</CRS>
<Units>K</Units>
<BoundingBox CRS="EPSG:4326" minx="-179.75" miny="-90.0" maxx="180.0" maxy="90.0" />
<Dimension name="time" units="ISO8601" default="2025-01-24T06:00:00Z">2024-05-12T18:00:00Z,2024-05-13T00:00:00Z,[SNIP],2025-01-22T18:00:00Z,2025-01-23T00:00:00Z,2025-01-23T06:00:00Z,2025-01-23T12:00:00Z,2025-01-23T18:00:00Z,2025-01-24T00:00:00Z,2025-01-24T06:00:00Z</Dimension>
<Dimension name="step" units="" default="0 nanoseconds">0 nanoseconds,3600000000000 nanoseconds,[SNIP],1350000000000000 nanoseconds,1360800000000000 nanoseconds,1371600000000000 nanoseconds,1382400000000000 nanoseconds</Dimension>
<Style>
<Name>raster/default</Name>
<Title>Raster</Title>
<Abstract>The default raster styling, scaled to the given range. The palette can be overridden by replacing default with a matplotlib colormap name</Abstract>
<LegendURL>http://compute.earthmover.io/services/earthmover-demos/gfs/main/solar/wms/?service=WMS&request=GetLegendGraphic&format=image/png&width=20&height=20&layers=t2m&styles=raster/default</LegendURL>
</Style>
</Layer>
<Layer queryable="1">
<Name>tcc</Name>
<Title>unknown</Title>
<Abstract>tcc</Abstract>
<CRS>EPSG:4326</CRS>
<CRS>EPSG:3857</CRS>
<CRS>CRS:84</CRS>
<Units>%</Units>
<BoundingBox CRS="EPSG:4326" minx="-179.75" miny="-90.0" maxx="180.0" maxy="90.0" />
<Dimension name="time" units="ISO8601" default="2025-01-24T06:00:00Z">2024-05-12T18:00:00Z,2024-05-13T00:00:00Z,[SNIP],2025-01-22T18:00:00Z,2025-01-23T00:00:00Z,2025-01-23T06:00:00Z,2025-01-23T12:00:00Z,2025-01-23T18:00:00Z,2025-01-24T00:00:00Z,2025-01-24T06:00:00Z</Dimension>
<Dimension name="step" units="" default="0 nanoseconds">0 nanoseconds,3600000000000 nanoseconds,[SNIP],1350000000000000 nanoseconds,1360800000000000 nanoseconds,1371600000000000 nanoseconds,1382400000000000 nanoseconds</Dimension>
<Style>
<Name>raster/default</Name>
<Title>Raster</Title>
<Abstract>The default raster styling, scaled to the given range. The palette can be overridden by replacing default with a matplotlib colormap name</Abstract>
<LegendURL>http://compute.earthmover.io/services/earthmover-demos/gfs/main/solar/wms/?service=WMS&request=GetLegendGraphic&format=image/png&width=20&height=20&layers=tcc&styles=raster/default</LegendURL>
</Style>
</Layer>
</Layer>
</Capability>
</WMS_Capabilities>%
Data Queries
GetMap
https://compute.earthmover.io/v1/services/wms/earthmover-demos/gfs/main/solar/wms?version=1.3.0\
&service=WMS&request=GetMap\
&layers=gust&styles=raster/default&colorscalerange=0,40\
&width=512&height=512\
&tile=2,2,2&crs=EPSG:3857\
&time=2024-11-1T00:00:00Z&step=1+hour
Click here to view this request in your browser. You should also see the tile below.
.
Required parameters are:
layers: array name;styles: always begins withraster/followed by any one ofmatplotlib's colormaps;colorscalerange=min,max: range of colorbar. (ignored if the optionalautoscaleis True);widthandheight: size in pixels;crs: Coordinate Reference System to render to, onlyEPSG:3857orEPSG:4326are supported at the moment;tileorbbox: the region to render (one of the two is required).tileis Mercator coordinates inx,y,z, if specified,crsMUST beEPSG:3857.bboxis specified in the requested CRS;
Optional parameters are:
autoscale: True/False, whether to scale each tile individually.
In the above example time and step are specified to subset the data.
If any coordinate of an array with more than 2 dimensions is unspecified, the first index is selected.
The exception is the time dimension, for which the last index is selected.
Help! I don't see anything!
- Make sure all required parameters are set (see above section), especially
colorscalerange. - Our service does not render individual tiles that require more than 1GB of input data, so zooming in will help. Use this slippy map here to choose a tile at a higher zoom level for the region you are interested in.
- Ensure that the "latitude", "longitude", and "time" (if any) variables have appropriate CF attributes set, e.g.
standard_name: "latitude",standard_name: "longitude", andstandard_name: "time"respectively.