NOAA Global Forecast System (GFS)
Original Data
The original dataset is located at https://www.ncei.noaa.gov/products/weather-climate-models/global-forecast
The Global Forecast System (GFS) is a National Centers for Environmental Prediction (NCEP) weather forecast model that generates data for dozens of atmospheric and land-soil variables, including temperatures, winds, precipitation, soil moisture, and atmospheric ozone concentration. The system couples four separate models (atmosphere, ocean model, land/soil model, and sea ice) that work together to accurately depict weather conditions.
Earthmover maintains an Arraylake of GFS data for demo purposes. The dataset begins on 2024-05-12 and is updated every six hours following the GFS forecast cycle.
Arraylake Repo
The GFS Arraylake repo is called earthmover-public/gfs and is available to browse at https://app.earthmover.io/earthmover-public/gfs.
There is one sub-group within the repo:
solar- A set of surface variables relevant to solar energy forecasting, chunked using an isotropic schema suitable for both spatial and temporal queries.
Open Repo and explore contents
from arraylake import Client
import xarray as xr

client = Client()
repo = client.get_repo("earthmover-public/gfs")
repo
[2m2025-09-17T20:02:17.537753Z[0m [33m WARN[0m [1;33maws_runtime::env_config::normalize[0m[33m: [33msection [sso-session 'earthmover mac sso'] ignored; `'earthmover mac sso'` is not a valid identifier[0m
[2;3mat[0m /Users/runner/.cargo/registry/src/index.crates.io-1949cf8c6b5b557f/aws-runtime-1.5.7/src/env_config/normalize.rs:121
<icechunk.repository.Repository at 0x10ad31890>
session = repo.readonly_session(branch="main")
ds = xr.open_zarr(session.store, zarr_format=3, group="solar")
print(ds)
<xarray.Dataset> Size: 399GB
Dimensions:    (longitude: 1440, latitude: 721, time: 92, step: 209)
Coordinates:
  * time       (time) datetime64[ns] 736B 2025-08-25T18:00:00 ... 2025-09-17T...
  * longitude  (longitude) float64 12kB 0.0 0.25 0.5 0.75 ... 359.2 359.5 359.8
  * step       (step) timedelta64[h] 2kB 00:00:00 01:00:00 ... 16 days 00:00:00
  * latitude   (latitude) float64 6kB 90.0 89.75 89.5 ... -89.5 -89.75 -90.0
Data variables:
    gust       (longitude, latitude, time, step) float32 80GB ...
    tcc        (longitude, latitude, time, step) float32 80GB ...
    r2         (longitude, latitude, time, step) float32 80GB ...
    prate      (longitude, latitude, time, step) float32 80GB ...
    t2m        (longitude, latitude, time, step) float32 80GB ...
Attributes:
    description:  GFS data ingested for forecasting demo
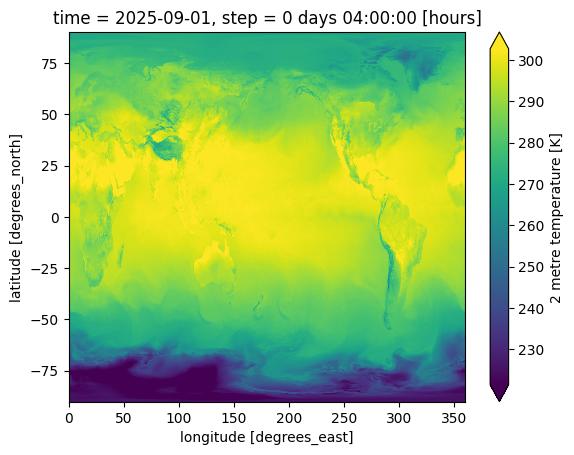
Spatial Query and Plot
Here we find a specific forecast and make a global map of surface temperature.
ds.t2m.sel(time="2025-09-01", method="nearest").isel(step=4).plot(x="longitude", robust=True)
<matplotlib.collections.QuadMesh at 0x11f8e1590>
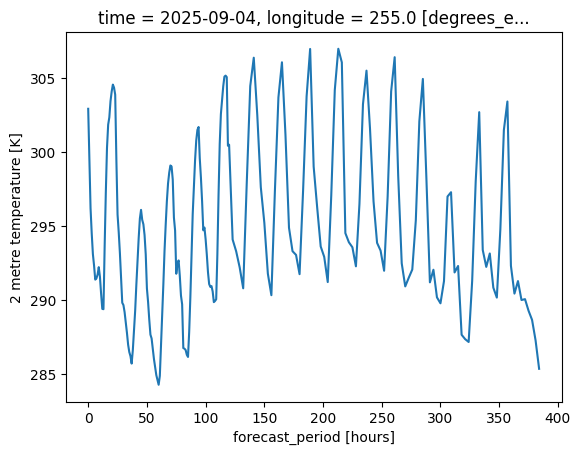
Timeseries Query and Plot
Here we extract the forecast at a specific location.
ds.t2m.sel(longitude=255, latitude=40, time="2025-09-04", method="nearest").plot()
[<matplotlib.lines.Line2D at 0x11f88a210>]